
This is the latest in a series of videos with Windermere Principal Economist Jeff Tucker titled Local Look where he delivers the key economic numbers to follow to keep you well-informed about what’s going on in the local real estate market.
Hi. I’m Jeff Tucker, principal economist at Windermere Real Estate, and this is a Local Look at the October 2024 data from the Northwest MLS.
All in all this was an incredibly strong report for the Washington housing market, especially in the single-family residential segment, which I’ll be focusing on today.
Here are the four key metrics I watch to get a sense of the market: sales, which tell us a lot about demand; and listings, which tell us about the state of supply.

In total we saw residential closed sales climb by over a thousand from the same month last year, or 24%. And, as an important leading indicator for next month’s sales data, pending sales were up 27% year-over-year.
On the supply side, I think of listings as the reservoir of options for buyers to choose from: New listings, which represent the flow of supply, were up 24% in October, while the level of inventory in the reservoir climbed was 25% higher than a year ago. This looks like a market returning to a more healthy balance between buyers and sellers, although of course we expect the usual seasonal decline in inventory to begin any day now.
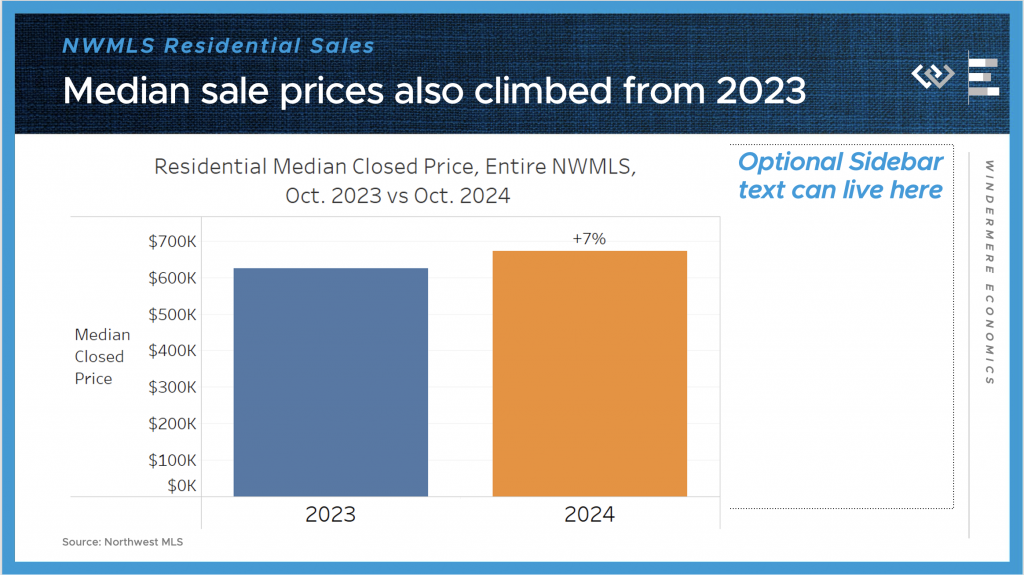
Also impressive to me: across the NWMLS, the median price for those closed single-family sales climbed more than 7% year-over year, from $625,000 to $671,500.
All in all it seemed that buyers finally responded in a big way, to the growth in active listings to choose from, as well as the decline in interest rates over the course of the summer. And while mortgage rates did rebound back up over the course of October, it seems like the news about how much downward progress they made, and the number of options to choose from, all helped to entice buyers to forge ahead with purchasing plans last month.
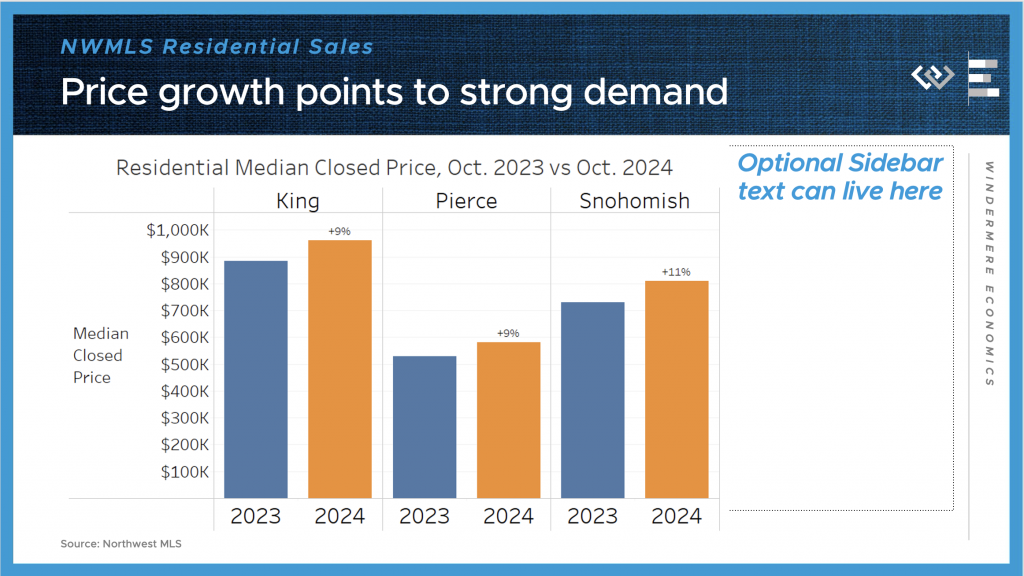
I can’t get into every local market, but just digging into the three counties that comprise the Seattle MSA, we saw similar trends play out, with especially high activity in King County, which includes Seattle and Bellevue.

Residential closed sales jumped a whopping 33 percent here in King County, and a still impressive 26% down in Pierce County, including Tacoma, and 20% up in Snohomish, including Everett.
The median sale price for those closed sales climbed 9% in King County, up to $960,000; 9% in Pierce County, up to $580,000; and 11% in Snohomish County, up to $730,000.
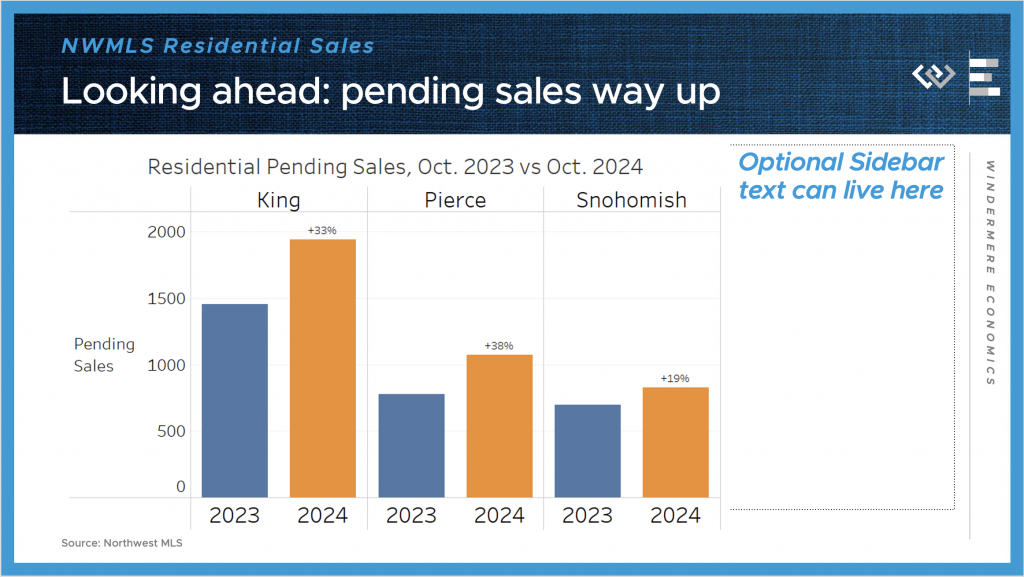
Looking ahead there’s not much sign of a slowdown, as pending sales were up 33% again for King County; 38% in Pierce, and 19% in Snohomish County.
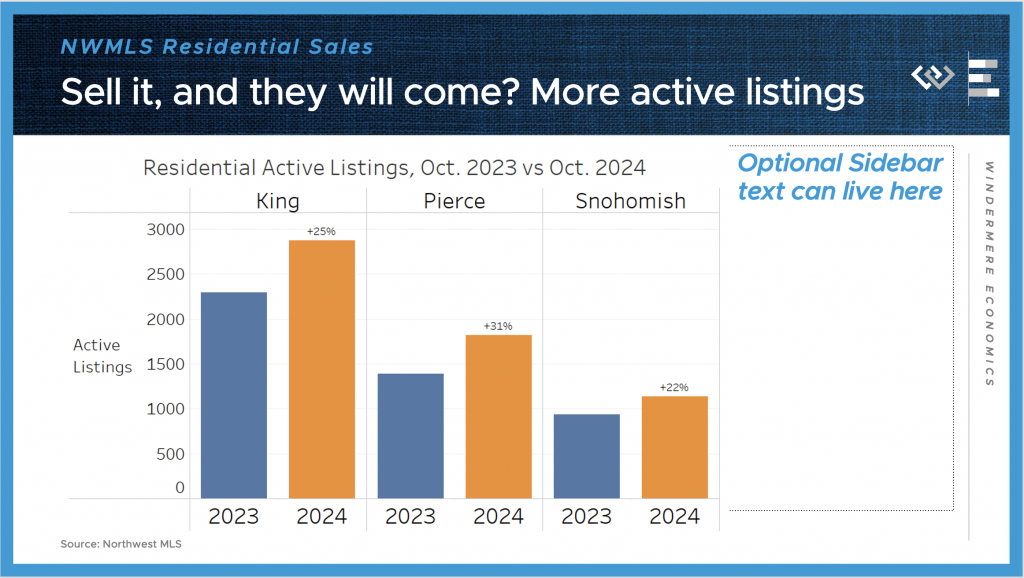
Even after all those sales, there are still a lot more single-family houses on the market around the 3-county region than this time last year, with about 25% more in King County; 31% more in Pierce, and 22% more in Snohomish County.
All in all this was a very encouraging report showing signs of life returning to the local housing markets around Washington, and maybe most importantly, a proof of concept that when mortgage rates fall, even just to near 6%, activity in the market picks up and people get back to moving, buying and selling.